Quick Start
1. Open a display file
Section titled “1. Open a display file”Open any DDS display file source (.dspf, or a source member opened through Code for i) in VS Code or IBM Bob.
2. Open the Explorer view
Section titled “2. Open the Explorer view”Go to the Explorer view (the file icon in the Activity Bar, Ctrl+Shift+E / Cmd+Shift+E).
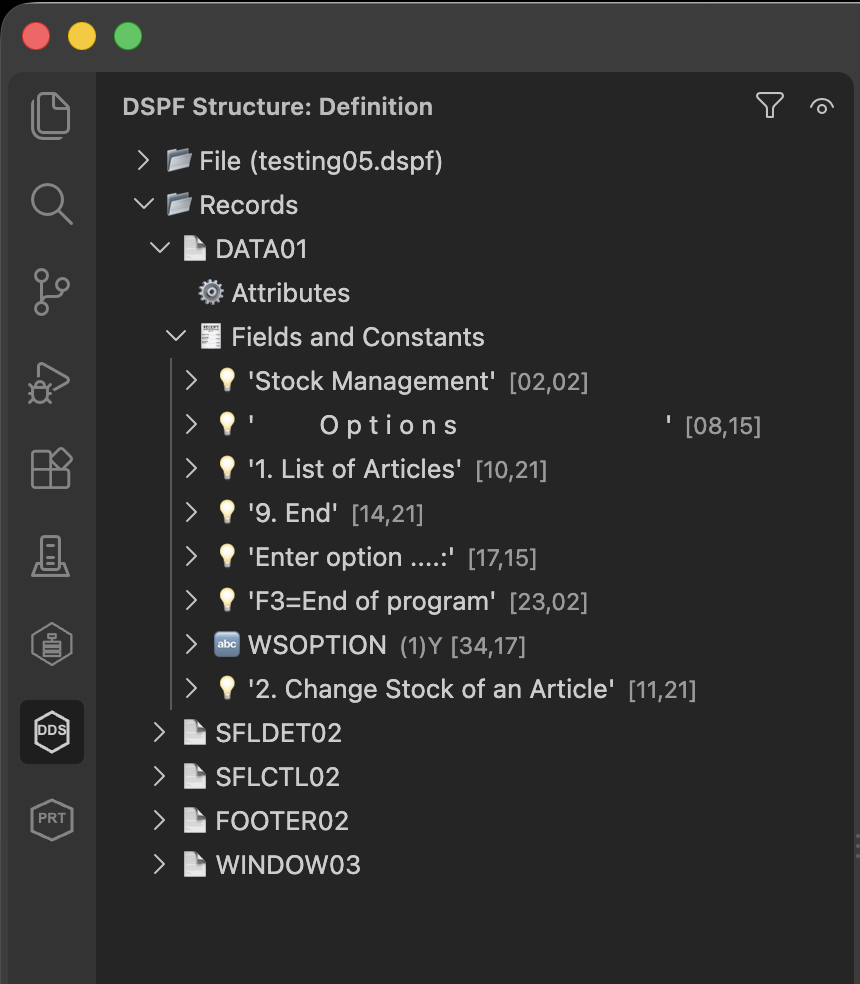
A new panel named DSPF STRUCTURE appears automatically, showing the schema tree for the file you have open.
3. Explore the schema tree
Section titled “3. Explore the schema tree”The tree shows two levels:
- File — display file attributes (display size, command keys).
- Records — each record’s own attributes, and its fields and constants.
Left-click an element to jump directly to its location in the DDS source. Right-click for context-aware actions (add a field, assign a command key, change indicators, and more) — see Schema Tree for the full list.
4. Preview a record
Section titled “4. Preview a record”Right-click a record and choose Preview Screen Layout (or use the inline preview button next to the record in the tree). A green-screen-style preview opens showing that record’s fields and constants at their real screen positions.
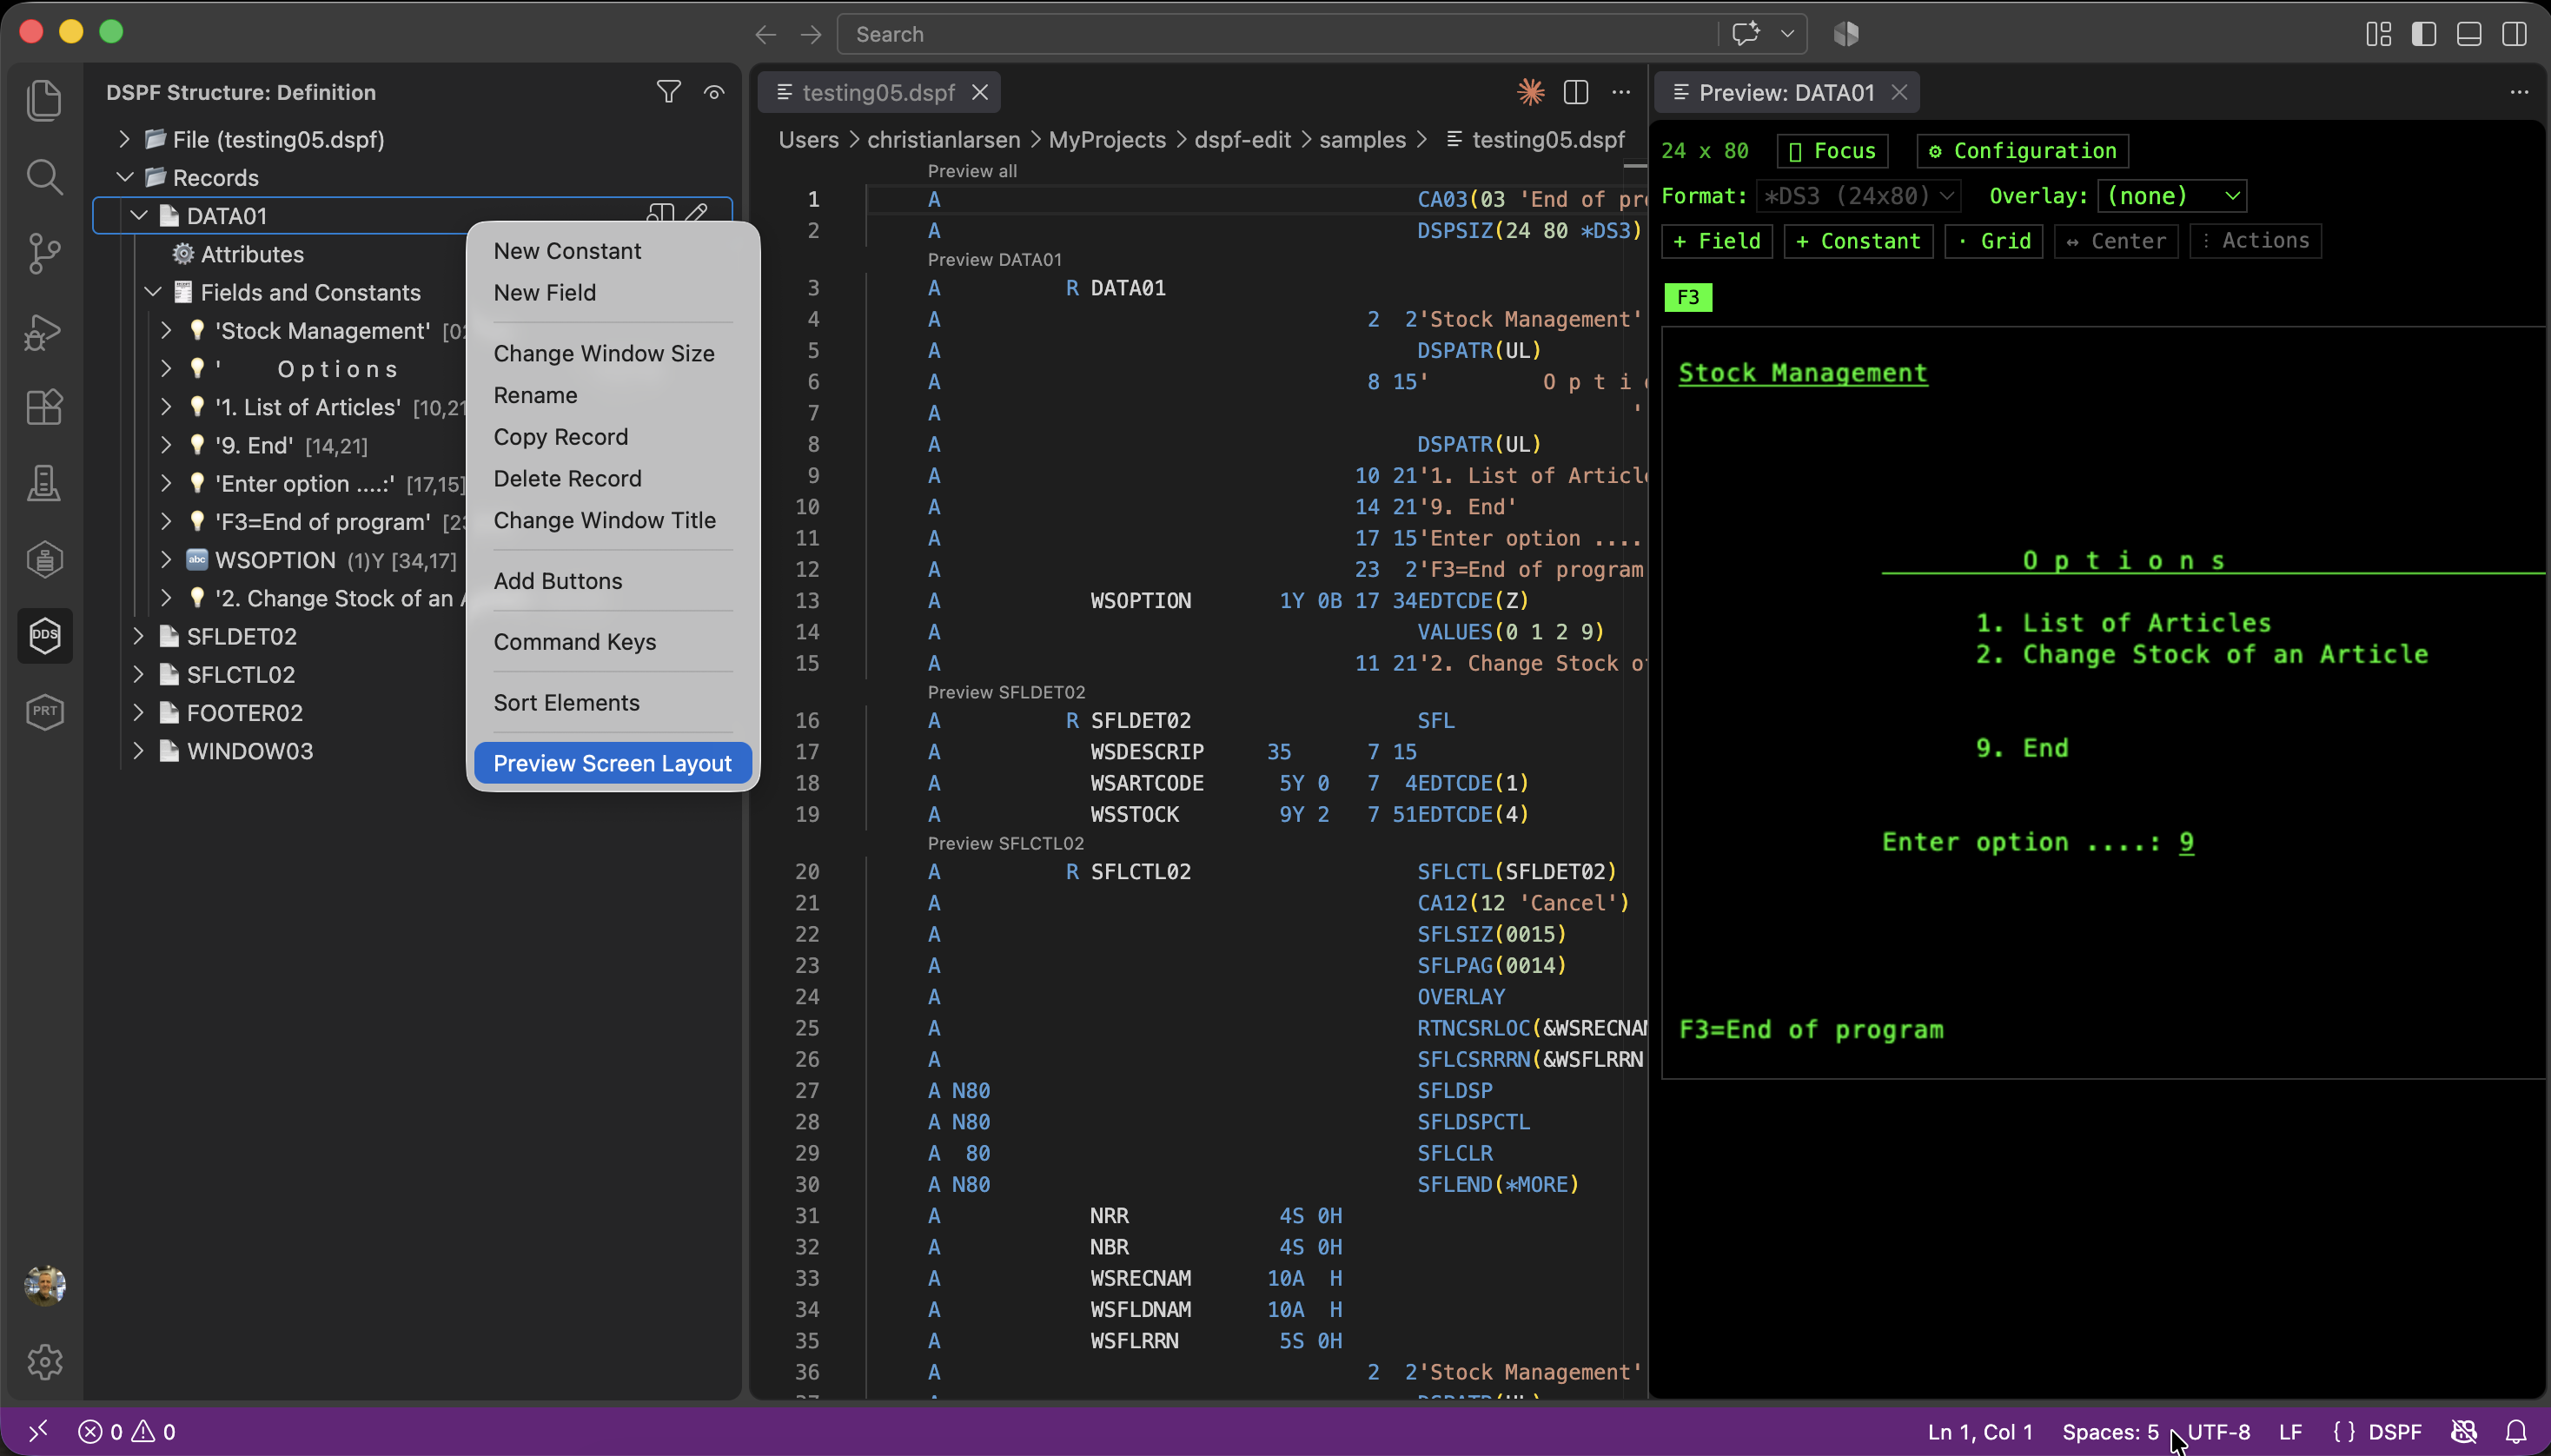
From the preview you can drag fields and constants to reposition them, simulate indicators, switch display format, and more — see Screen Preview.
Where to next
Section titled “Where to next”- Schema Tree — the full navigation and right-click reference.
- Screen Preview — everything the preview panel can do.
- Fields, Constants, Records — adding and editing elements.
- Indicators and Conditions — conditioning what’s visible.